Due to limitations on manufacturing and transport, COVID-19 has had a significant impact on U.S. imports. The top 20 U.S. ports have seen a drastic change in import volume, according to a report released by Descartes Datamyne.
This top 20 U.S. port report released by Descartes Datamyne ranks 2019 port performance and the early impact of COVID-19. Descartes Datamyne provides the world’s largest searchable trade database, including the global commerce of 230 markets across five continents.
The import volumes of the top 20 U.S. maritime ports were evaluated using Twenty-foot Equivalent Units (TEU). The report gives insight into the impact of COVID-19 on U.S. imports by comparing Bills of Lading data from January through May of 2020 with the same data from 2019.
The Impact of COVID-19 on the Top 20 U.S. Ports, Ranked
- Los Angeles, CA
The early impact of COVID-19 was substantial for imports into the Port of Los Angeles because China is by far the leading source. Total TEU volumes have dropped approximately 100k per month, leading to a total decline of 388k. That means that import volumes have dropped approximately 21.1% compared to 2019. Total Chinese import volumes dropped 227k during the first five months of the pandemic, which accounted for most of the decline.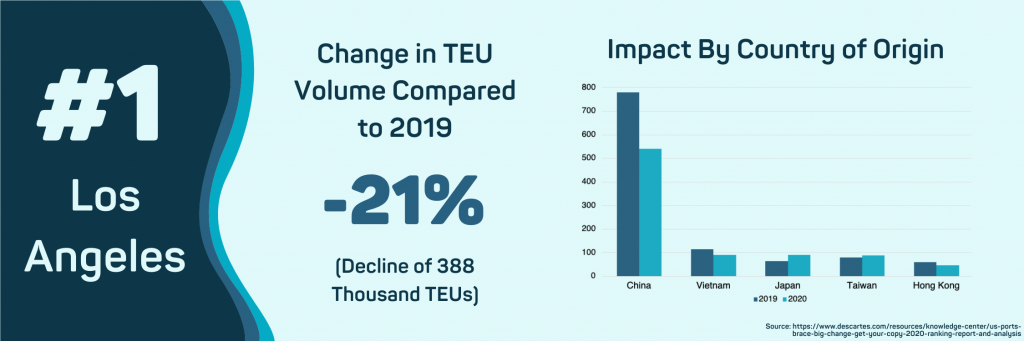
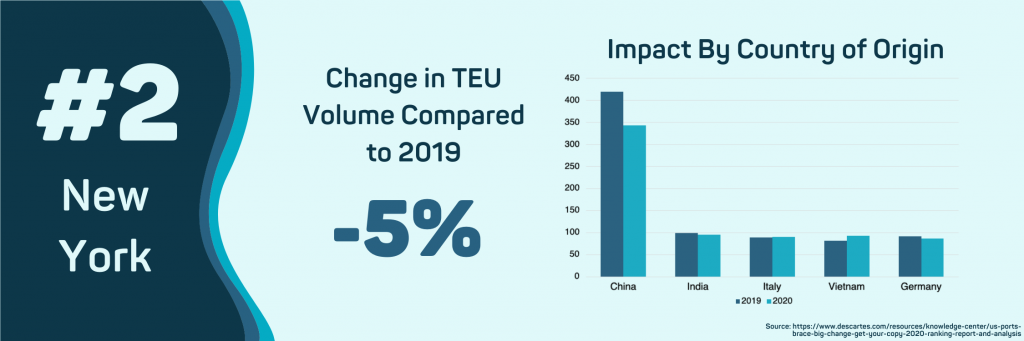
- New York, NY
The COVID-19 outbreak has had a substantial impact on import volumes into the Port of New York and New Jersey, with overall imports declining 5% compared to 2019. The impact of COVID-19 has been minimized due to the port’s diverse countries of origin. Imports from China have fallen 19.28% compared to 2019. This has been offset by steady volumes from other countries of origin, with imports from Vietnam increasing by 21.86% to 90k TEUs.
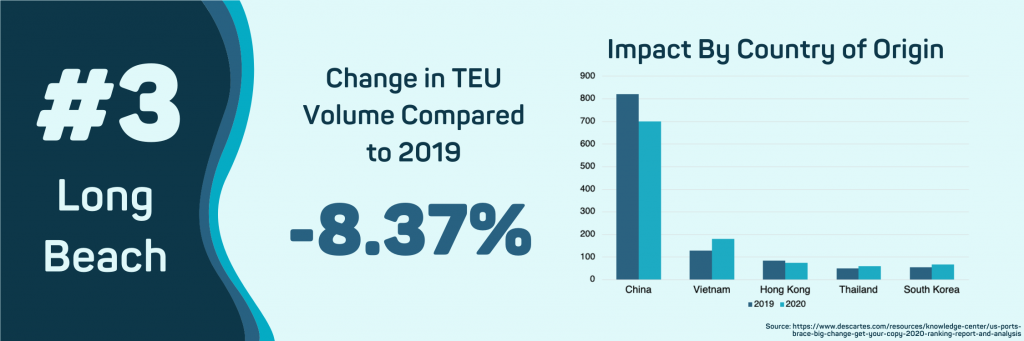
- Long Beach, CA
COVID-19 has resulted in an overall decline in import volume of 8.37% since this port relies on Chinese products. This is a far less dramatic drop than the Port of Los Angeles despite both ports receiving a similar percentage of its goods from China. The primary reason for this comparatively smaller decline is a sharp increase in shipments from other Asian countries such as Vietnam, Thailand, and South Korea. Particularly with Vietnam, export volumes to the Port of Long Beach increased by 29.78%.
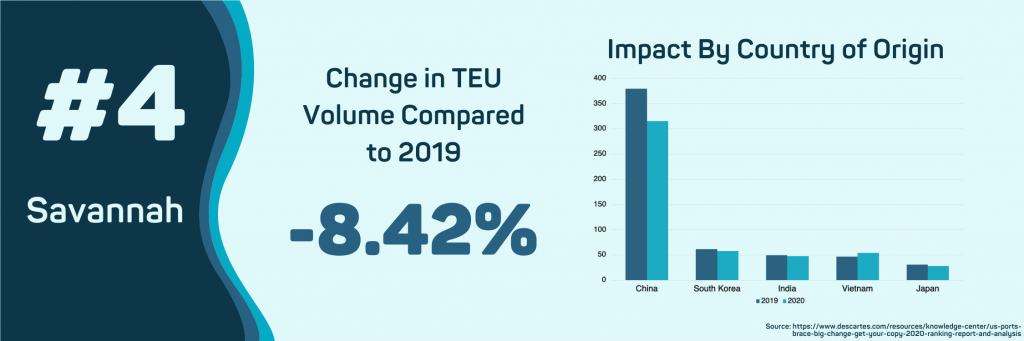
- Savannah, GA
Import volume has declined by 8.42% in the first five months of 2019 compared to 2018. The primary reason for this decline is a reduction of shipments from China, with total volumes dropping 16.75%. The downturn in Chinese exports has been offset with an increase in shipments from Vietnam. So far, in 2020, imports from Vietnam to the Port of Savannah have increased by 29% compared to 2019. The total FOB value for imports during the outbreak has fallen by 7.57%.
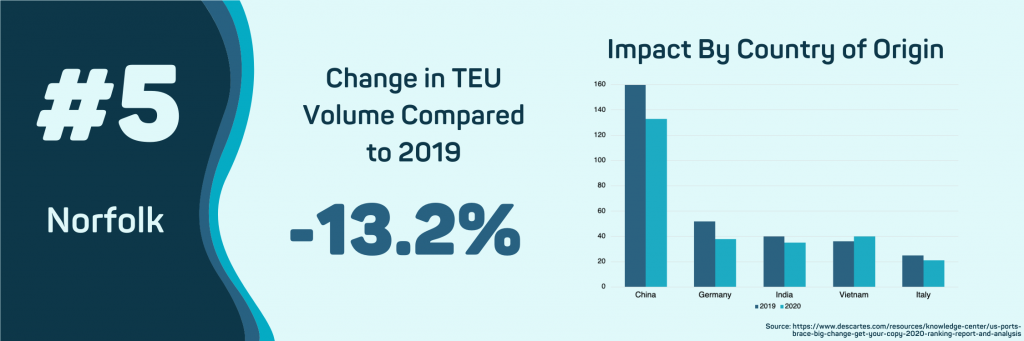
- Norfolk, VA
Norfolk has experienced the second-largest impact in import volume, falling 13.2% in the first five months of 2020 compared to 2019. This decline is caused by the falling number of shipments from China, which has decreased by 17.56%. Increases from other countries of origin have not offset this decline from China. Germany, the second leading supplier of shipments into the Port of Norfolk, has declined 29.5% from 2019 since the beginning of COVID-19.
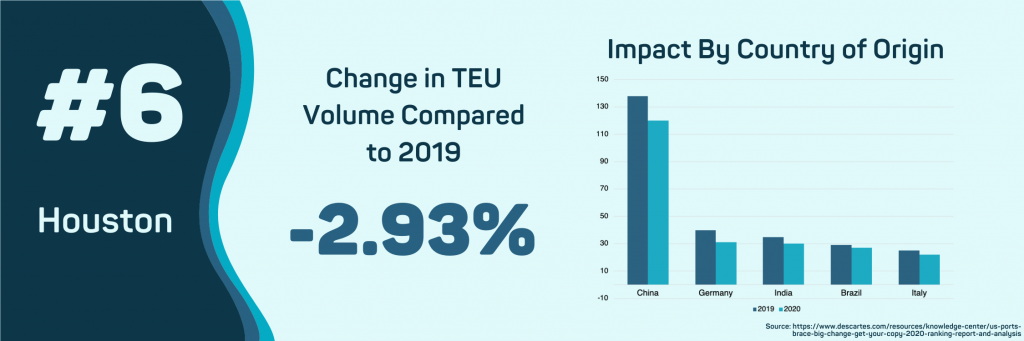
- Houston, TX
The impact of COVID-19 on the volume of imports into the Port of Houston has been minimal, only decreasing 2.93% in the first five months of 2020 compared to 2019. As the year goes on, the impact on imports and import values at this port will depend on if the price of oil continues to fall.
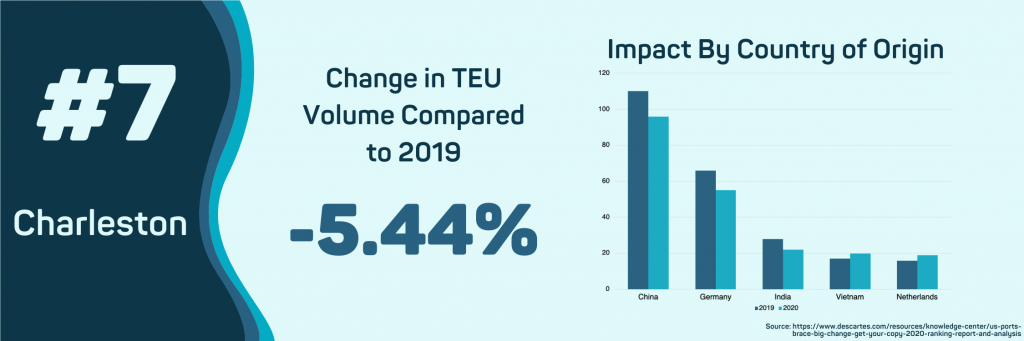
- Charleston, SC
The Port of Charleston has seen a decline in import volume of 5.44%. Charleston’s declining volumes are due to reduced shipments from China and Germany, the port’s top two countries of origin. Automotive parts and accessories remain the top imported commodity by value at this port during the pandemic. The overall value of medicine imports to this port has risen 32.88% in 2020 compared to 2019.
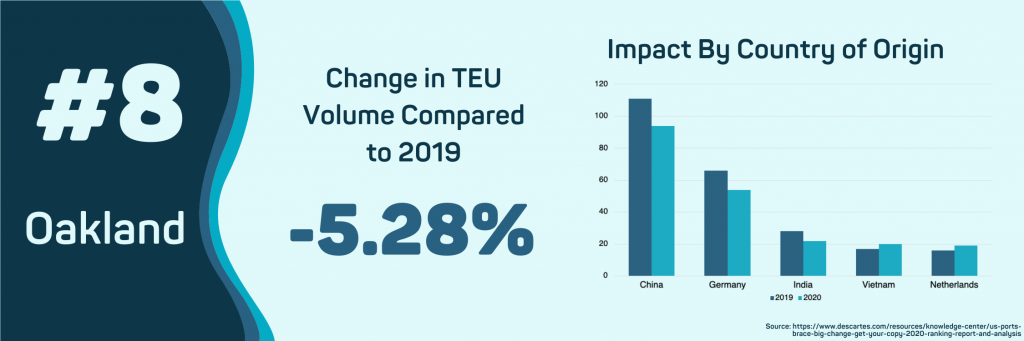
- Oakland, CA
The Port of Oakland receives enough imports from China to be impacted by COVID-19. So far, in 2020, the port has processed 220 thousand TEUs, a 5.28% decrease from 2019. Vietnam, Taiwan, South Korea, and Thailand, some of this port’s primary sources of shipments, have seen slight increases in overall volume in 2020.
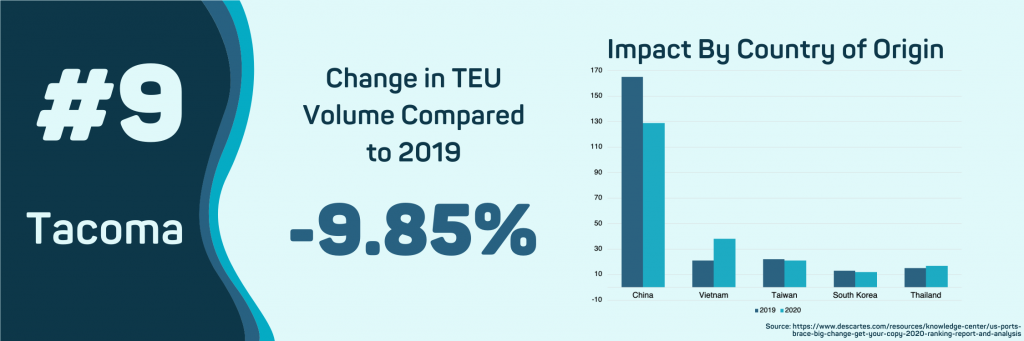
- Tacoma, WA
Imports to this port have slowed down during the COVID-19 outbreak by 9.85%. Tacoma’s declining volumes are the result of reduced shipments from China. So far this year, Chinese shipments to Tacoma have fallen 22.75%. Exports from Vietnam to the Port of Tacoma have increased by 67.71%, with a total volume of nearly 38 thousand TEUs.
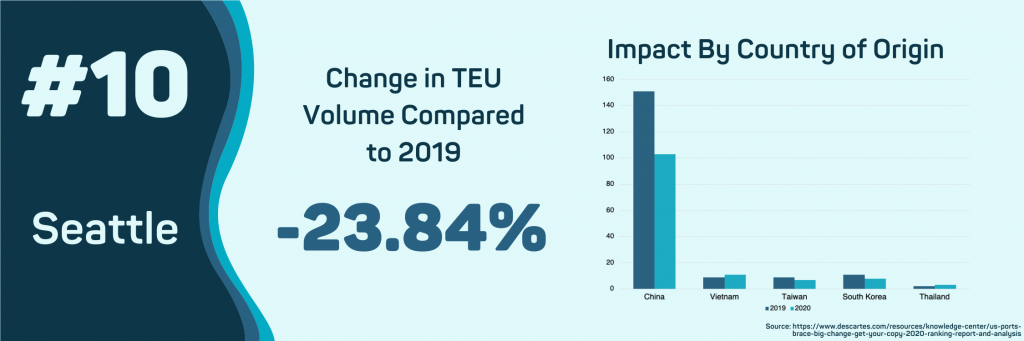
- Seattle, WA
Imports into the Port of Seattle have deceased so far in 2020. The difference between the decrease in Seattle compared to other ports is that the decrease in import volume began in September of 2019. The Port of Seattle is one of the most impacted ports since they experienced a sluggish peak season. Parts for airplanes and aircraft remain the top valued commodity imported into the Port of Seattle. Still, the value of importing these parts has plummeted 41.67% so far in 2020.
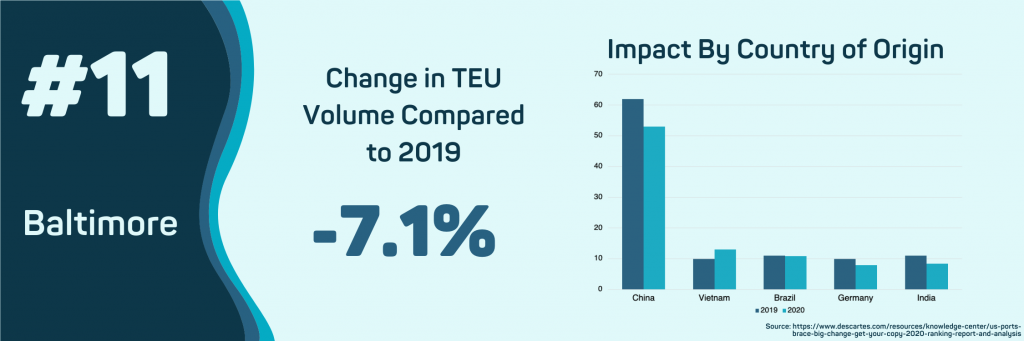
- Baltimore, MD
Imports to this port have fallen 7.1% so far in 2020. Shipments from China have dropped 14.6%, and imports from India have declined by 23.9%. Increases in shipment volumes from other Asian countries have been the only positive note in 2020 performance. Imports from Vietnam have increased by 28.1% with Taiwan, Malaysia, South Korea, and Thailand all seeing an increase in imports.
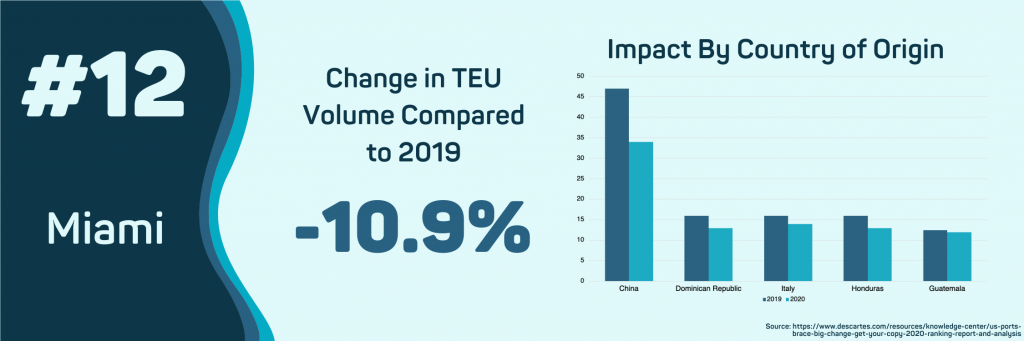
- Miami, FL
The Port of Miami had the sharpest single-month decline in imports. While the 10.9% decrease is not outside the norm, the vast majority of that decline happened in April as the monthly TEU volume processed by the port fell below 30 thousand for the first time in over three years. This decline is the result of idle Chinese exports, with year-over-year volume falling 28.5%.
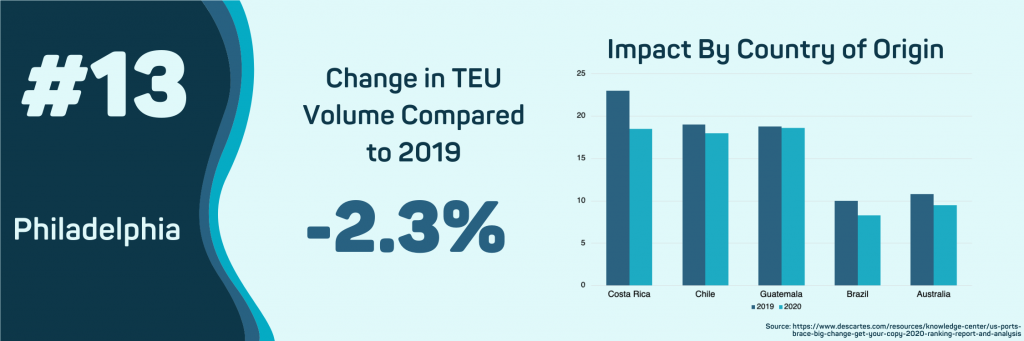
- Philadelphia, PA
This port has seen little to no impact from the COVID-19 outbreak, with overall import volume only declining 2.3%. The ultimate impact of COVID-19 on the Port of Philadelphia will depend on whether the price of oil rebounds. So far, in 2020, the total FOB value of crude oil is down 29% compared to 2019. Many of Philadelphia’s top countries of origin will be impacted by the significant decrease in oil prices, creating a trickle-down effect that will impact other commodities as the year continues.
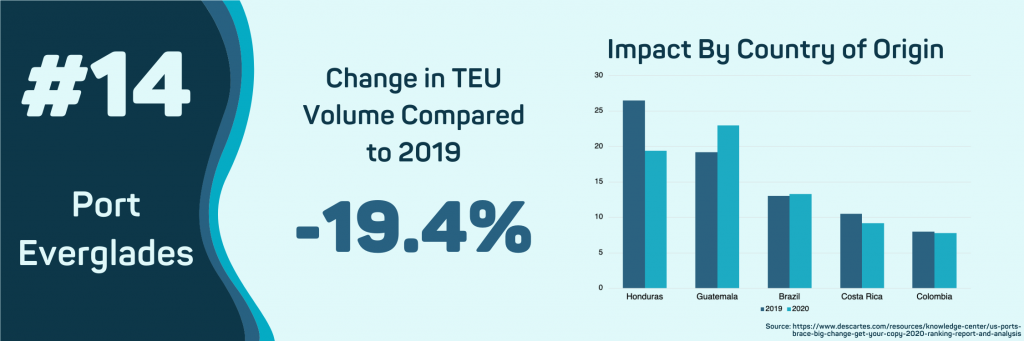
- Port Everglades, FL
Port Everglades has seen a drastic decline in the total FOB value of Petroleum. So far, in 2020, Petroleum imports to this port are just over $347m, a 42.3% decline compared to 2019. The drop in oil imports has also impacted Port Everglade’s overall import volume, dropping 19.4% in year-over-year volume.
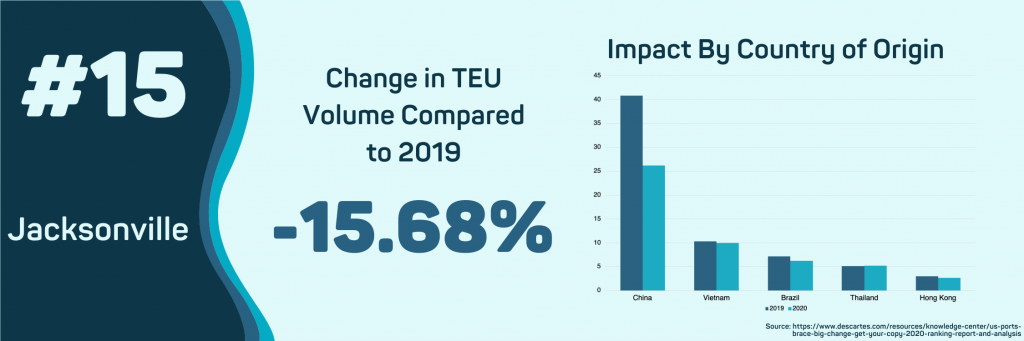
- Jacksonville, FL
The impact of COVID-19 has caused imports into the Port of Jacksonville to fall 15.68%. This decline is the result of a 33.14% decline in imports from China. The Port of Jacksonville’s top commodity is passenger motor vehicles, whose imports have seen the sharpest decline in volume and value since the beginning of the outbreak. So far, in 2020, the total FOB value for passenger motor vehicles has dropped 21.05%, and the total number of TEUs has declined by 22.9%.
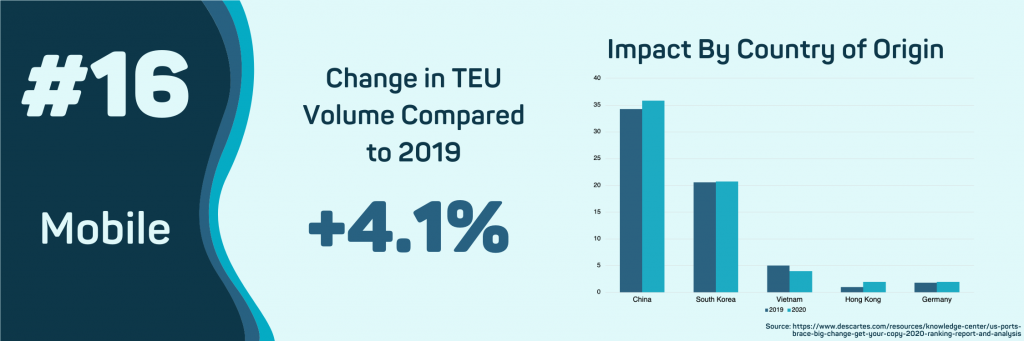
- Mobile, AL
The Port of Mobile has seen the most significant year-over-year growth so far in 2020. It is the only port to see an increase in the number of shipments from China, Hong Kong, and Germany. The total number of imports has increased by 4.1% compared to 2019. However, the value of shipments coming into the Port of Mobile has fallen substantially in 2020. Their top-ranked commodity, petroleum oil, has dropped 27.2% in overall FOB value, and wood pulp has seen import values fall 74.1%.
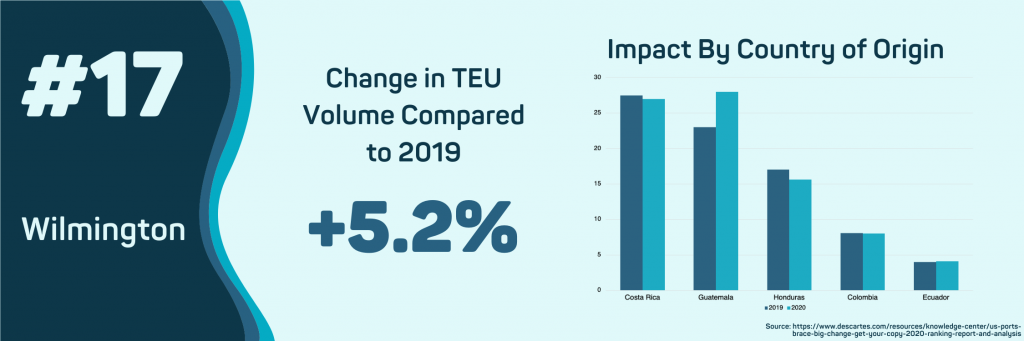
- Wilmington, DE
The Port of Wilmington is the only port to see growth in import volume so far in 2020. This is due to an increase in volume from Guatemala, the port’s top country of origin in 2020. So far, the volume of shipments from Guatemala has grown 20.28% this year. Guatemala’s primary export to the Port of Wilmington is Bananas. While overall import volume may continue to rise, the value of imports into this port will continue to decline from 2019 unless the price of oil recovers.
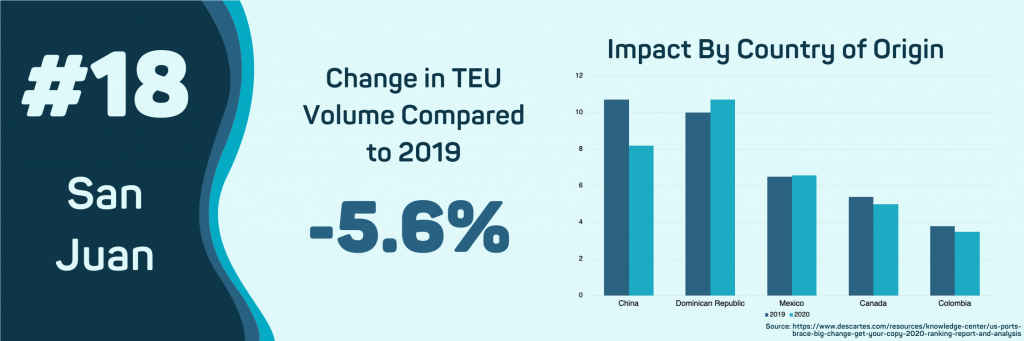
- San Juan, PR
The impact of COVID-19 has caused import volumes into the Port of San Juan to fall 5.6% to about 64 thousand TEUs. This drop off is due to the slowing of shipments from China, which have fallen 19.9%. The largest increases in import volumes are for specific commodities related to the pandemic like cleaning supplies and medical equipment. Paper towels and toilet paper have seen a 55.4% increase in year-over-year volume.
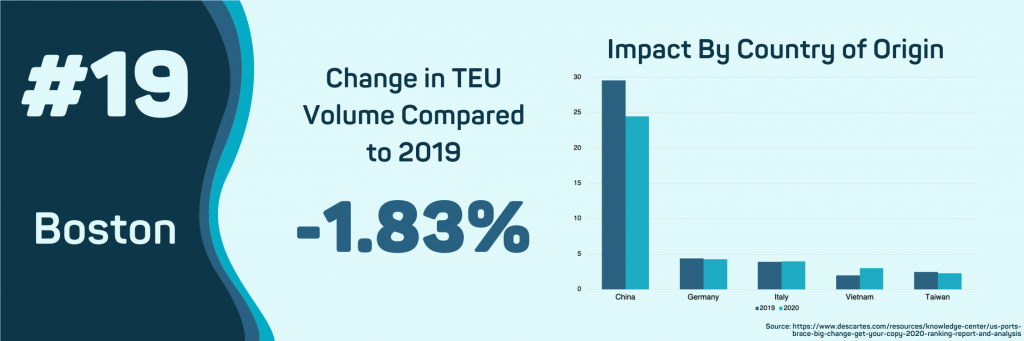
- Boston, MA
Import volumes into the Port of Boston have decreased by 1.83%. The top commodities by volume have seen large shifts and declines, highlighted by a 12.7% decline in furniture imports and a 16.1% decline in automotive parts. An increase in the shipment of products from Latin America is preventing a large-scale decline in overall import volumes in this port. The year-over-year increase in the imports of bananas is currently 5.84%. Prepared fruits and nuts increased by 8.6%.
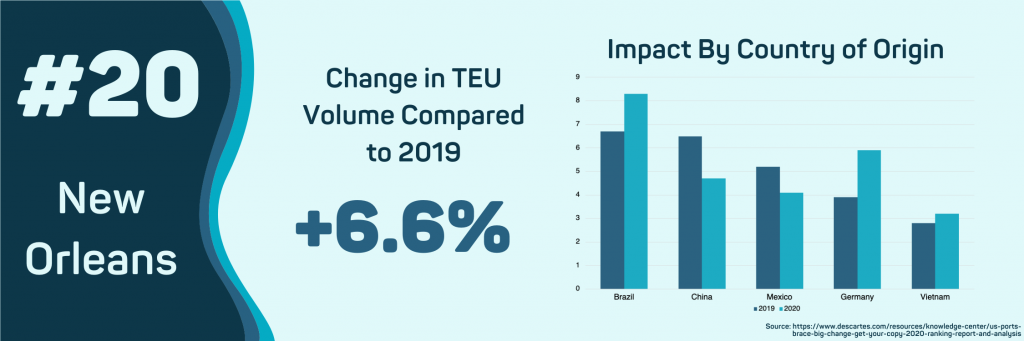
- New Orleans, LA
This port has seen positive growth in volume in 2020, stemming from a spike in imports from Brazil. Overall, import volume has increased by 6.6%, and shipments from Brazil specifically have increased by 84.7%. However, The total FOB value of these imports has seen a decline. Maritime import value has fallen 22.3%, and the value of airborne cargo has fallen 1.52%. The drop in maritime value is due to falling oil prices. The decrease in airborne cargo value is due to the cancellation of most passenger aircraft during the height of COVID-19.